Water Balance for Land Application of
Domestic Effluent
On-site wastewater planning tools
1.
Water balance
What is a water balance? Where is it used?
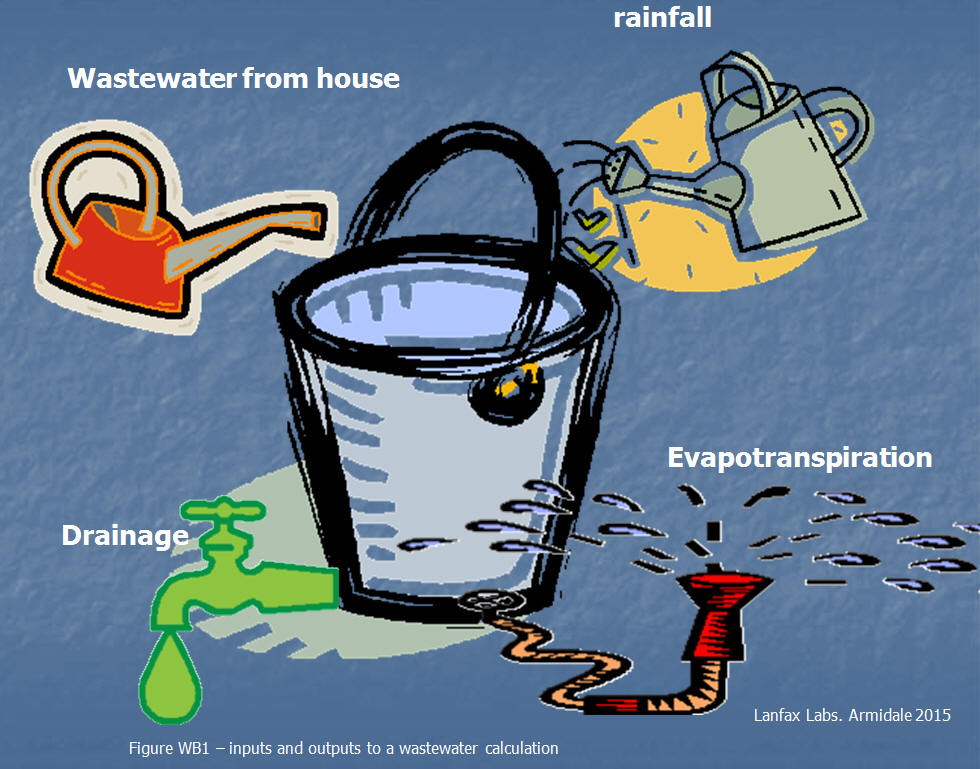
A water balance is a set of very simple calculations to balance all the inputs
affecting a wastewater system and all the outputs returning the hydraulic load
(the water) to the hydrologic cycle. Perhaps the easiest way to visualise
what is meant by water balance is to think of our wastewater system as a bucket
as shown in Figure 1.
 The
wastewater from the house (Ww) includes all those contributions shown in
Figure S1
under the 'septic tanks' page. The volume of wastewater generated by the
occupants depends upon many factors, over which they have some control. Some
households will generate more wastewater than neighbours because of the pattern of
water use within the home, those households conservative with water use will
generally have lower discharge volume, but not necessarily the load of nutrients
and solids..
The
wastewater from the house (Ww) includes all those contributions shown in
Figure S1
under the 'septic tanks' page. The volume of wastewater generated by the
occupants depends upon many factors, over which they have some control. Some
households will generate more wastewater than neighbours because of the pattern of
water use within the home, those households conservative with water use will
generally have lower discharge volume, but not necessarily the load of nutrients
and solids..
The rainfall (P for precipitation) is selected from one of the rainfall statistics for the local area (See under rainfall statistics). These data can been downloaded from the Bureau of Meteorology's website (www.bom.gov.au) and some simple statistical analysis conducted - we'll deal with this later.
Another term we need to define is "retained rainfall". When rain falls on the ground at reasonably high intensity (rate measured in mm/h), some water will enter the ground (absorption rate) and some water will runoff (runoff rate). The water that is absorbed by the soil is simply the difference between rainfall and runoff: retained rainfall. The runoff rate depends upon rainfall intensity and the nature of the topsoil (previously wet or dry), slope and vegetation (grasses and/or trees). Runoff only occurs when the rate of rainfall exceeds the infiltration rate.
So, our inputs are simply Wastewater (Ww) + Retained rainfall (Pr). The evapotranspiration (Et) is the water that is returned to the atmosphere as humidity from the transpiration of the vegetation and the evaporation from the soil. The combination is slightly less than the 'pan evaporation' as reported by the BOM because of shading of vegetation and the complex surface conditions compared with an open water surface. The use of a 'crop factor' to apply to the pan evaporation will be discussed later.
Drainage is the downward movement of water out of the root zone that replenishes the soil moisture and drains towards the groundwater, or deep within the soil profile. The drainage rate is dependent upon soil type (structure and texture), soil depth, availability of water and its continuum.
Figure 1. Water balance illustration
Soil water storage is the capacity of the soil to store water within its voids (spaces between soil particles). Over time, this physical capacity to store water within the soil mass may change rapidly or slowly depending upon how the water balance is affected by the inputs (rainfall and wastewater) and the extractions (drainage and evaporation). We, therefore, have a highly variable term within our water balance that accounts for the soil's ability to act as a reservoir for water. In most cases, around 40% of the soil volume can store water within the soil pores and capillaries, although some of this space is only occupied when the soil is saturated. It is this stored water that sustains plants and animals (microbes) in the periods between rainfall events. Figure Q1 in AS/NZS 1547:2012 (page 180) shows the 'change in amount of water stored in the soil' as a component of the water balance as 'delta S'. Delta being the symbol denoting 'changing or variable'.
Thus, the outputs are: Evapotranspiration (Et) + Drainage (D)
The simple arithmetic is: Monthly water (variable soil water store) = (Ww + Pr) - (Et + D). or we can re-write the equation as (Ww + Pr) = (Et + D) + delta S Where delta S = variable soil water store
Think of the last equation as financial accounts. Bank balance (variable store) = Money comes in - money goes out
In Figure 1, the bucket has a finite size. When the inputs exceed the output, the volume of water in the bucket increases, when the outputs exceed the inputs, the volume of water in the bucket decrease. If the inputs versus the outputs cause the bucket to overflow, a bigger bucket is needed until such time as there is no overflow. We use the same logic to design an effluent trench or an irrigation area, carefully designing the size of the system to contain all the wastewater and have a reserve capacity as well..
If we measure all these variables as millimetres depth, the result is simply in millimetres.
2. CONVERSION OF VOLUME TO DEPTH
The metric systems allows us to do some very simple conversions. One
litre of water is equivalent to one millimetre of water over one square metre. So when it rains, say 10 mm over your roof area of 300 m2,
then 3000 L of rainwater will be added to your tanks. If your house generates
600 L/day of wastewater, and you live in a relatively dry region, and get
winter evapotranspiration and drainage of 6 mm/day, then you need 100 m2
of irrigation area to adequately dispose of all the wastewater.
From now on, we can use litres and millimetres to describe our inputs and outputs, and square metres to describe the land application area (trench or irrigation area).
3. WATER BALANCE
VARIABLES
The example used above shows that wastewater
generation of 600 L/day required an irrigation area of 100 m2 when we had combined drainage and evapotranspiration
of 6 mm/day in winter was just too simplistic. If we design to a hot and dry summer the system
would fail in the winter when evapotranspiration is significantly less. In some
area, though, summers are wet and winters are dry.
We need a good water balance model to modify our equation for each and every month (or day) of the year based upon historic rainfall and evapotranspiration for our specific locality to design the appropriate size trench or irrigation area We are going to modify our water balance to adjust for typical local conditions and include drainage rates and the potential for soil water storage.for the soil profile or trench.
Measurement of evaporation
 Weather
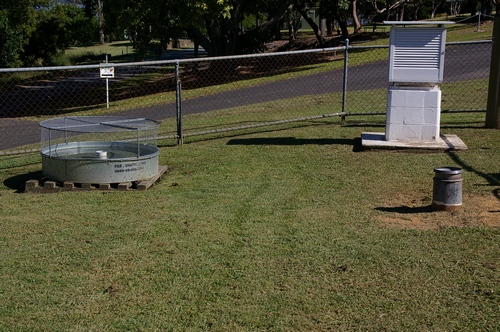
stations provide a range of measuring devices at a particular locality. Figure
2 shows the weather station at a dam in southern Queensland. The Class A evaporation pan to the left is manually operated daily to allow the
calculation of the depth of daily evaporation from an open water source. While the wire screen may impart some imperfection to the measurement, access by
birds and kangaroos has to be prevented. A rain gauge is seen in the right
foreground, a large diameter catch surface increases the accuracy of collection. Often rain gauges are fitted
internally with tipping buckets to measure the intensity of the rainfall -
millimetres per hour. The white box is a Stevenson Screen - a special
white painted, slatted box, sited 1.2 m above the ground in which temperature
and humidity are measured, now mostly electronically, but previously as a daily
manual reading of a thermometer and a wet/dry bulb thermometer. Here we need to
consider the accuracy of the measurement rather than the precision of the
measuring device.
Weather
stations provide a range of measuring devices at a particular locality. Figure
2 shows the weather station at a dam in southern Queensland. The Class A evaporation pan to the left is manually operated daily to allow the
calculation of the depth of daily evaporation from an open water source. While the wire screen may impart some imperfection to the measurement, access by
birds and kangaroos has to be prevented. A rain gauge is seen in the right
foreground, a large diameter catch surface increases the accuracy of collection. Often rain gauges are fitted
internally with tipping buckets to measure the intensity of the rainfall -
millimetres per hour. The white box is a Stevenson Screen - a special
white painted, slatted box, sited 1.2 m above the ground in which temperature
and humidity are measured, now mostly electronically, but previously as a daily
manual reading of a thermometer and a wet/dry bulb thermometer. Here we need to
consider the accuracy of the measurement rather than the precision of the
measuring device.
Since the evaporation (Eo) from an open pan is consistent with evaporation when there is no hinderance from available water, the conversion to evapotranspiration (Et) is calculated by applying a 'crop factor' (Cf) to the open pan value. The crop factor suggest that loss of water varies seasonally for various plant species.
Evapotranspiration (Et) is the combined transpiration from plants and the evaporation from the exposed soil. Thus, Et = Eo x Cf. Read this as evapotranspiration = open pan evaporation multiplied by crop factor,
For most lawns and gardens, the crop factor is less than one, higher in summer when there is more atmospheric heat to drive the evaporation, and lower in winter when low temperatures reduce evaporation.
For most on-site wastewater modelling, average daily pan evaporation is used
(available from Bureau of Meteorology) multiplied by a summer crop factor of 0.8
and a winter crop factor 0f 0.6.
Figure 2. Weather station equipment
Evaporation from plants
 We
know that plants transpire, moving water from their roots, through their
stems to the leaves from where small cells within the leaves (stomates) provide
an interface with the atmosphere. When the atmosphere is drier than the
water vapour in the stomates, that water vapour evaporates (moves from the plant
into the atmosphere). This movement then 'sucks' up water through the
plant, a process that removes water from the soil around the roots.
While the actual process is more complicated than that, the simple explanation
will suffice for this discussion.
We
know that plants transpire, moving water from their roots, through their
stems to the leaves from where small cells within the leaves (stomates) provide
an interface with the atmosphere. When the atmosphere is drier than the
water vapour in the stomates, that water vapour evaporates (moves from the plant
into the atmosphere). This movement then 'sucks' up water through the
plant, a process that removes water from the soil around the roots.
While the actual process is more complicated than that, the simple explanation
will suffice for this discussion.
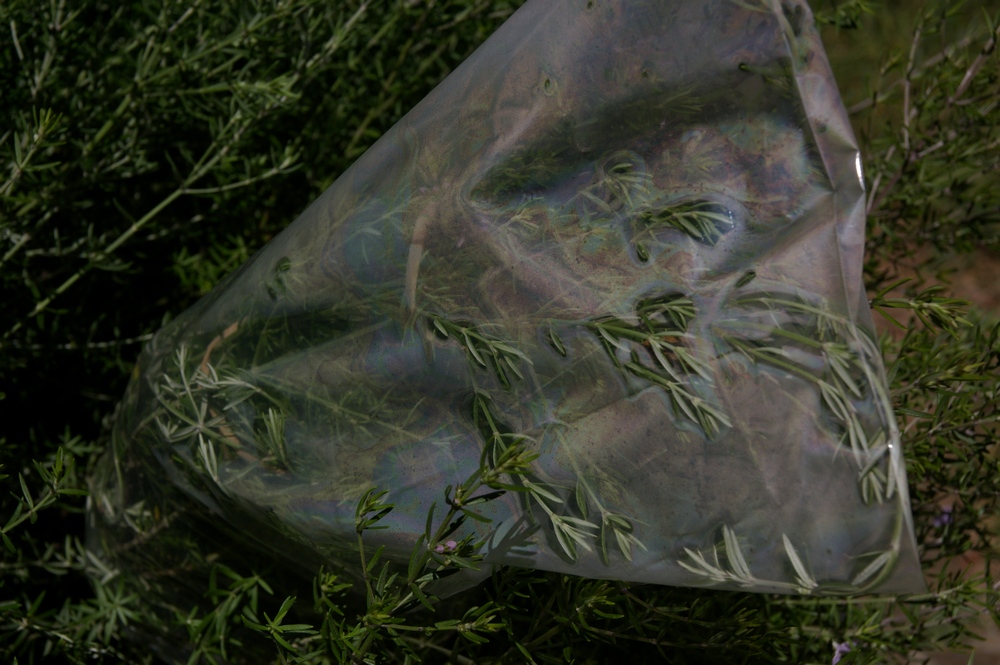
We can measure the evaporation from plants, although the exercise has a few drawbacks. We can demonstrate the process as shown in Figure 3 where a plastic bag is placed over a bunch of leaves and secured with a string tie. After some time, depending upon whether the bag is in the sun or not, you will observe water droplets on the inside of the bag and perhaps some water accumulating in the bottom of the bag. The sunlight is the driving force, 'sucking' water from the soil up through the plant to be lost to the atmosphere..
Because the water cannot evaporate through the plastic bag, the humidity increases which in turn slows down the evaporation. You know that feeling of 'sweating' on a very humid day - the same is occurring in the plastic bag. You could weigh the water, estimate the proportion of the plant that you had captured in the plastic bag and estimate the amount of water that the plant would transpire over a period.
The same exercise can be performed using a plastic sheet covering a square
metre of soil, capturing the water in a cup under the middle of the plastic
sheet depressed with a stone.
Figure 3. Transpiration from living plant
4. RAINFALL STATISTICS
Which rainfall statistic we use depends upon the level of
risk the authorities will allow us to have. It is not sensible to have a
system that will NEVER fail because we are relying upon the natural return of
the wastewater to the hydrologic cycle and a series of wet and low temperature
periods is likely to thwart all efforts to avoid a saturated soil profile. Thus, we need to implement a measure that will minimise the risk of failure while
avoiding negative impacts on human and environmental health. No mean
issue!
Rainfall: The Bureau of Meteorology's website provides daily and monthly summaries of rainfall for a large number of towns. A quick look at "Climate Data Online" (http://www.bom.gov.au/climate/data/) and you will see you can choose 'daily rainfall' or 'daily weather observations'. Your choice will depend upon the type of model you are running. For most purposes a monthly model will suffice, providing a reasonably conservative model for on-site wastewater estimation. You can download the data and open into a spreadsheet. Some statistics are already provided in the 'weather and climate - monthly statistics', or you can prepare your own statistical analysis on the annual records provided.
The simple terms you need to understand are:
mean or average calculated by
dividing the total of all observations by the number of observations.
median rank the observations from highest to lowest, and find the mid point value (half
the number of observations).
percentile rank rank the
observations from the highest to the lowest and find each 1/100 value.
So the 90th percentile is 10% down the number of observations from the highest. It is also the value that is either equalled or exceeded only 10% of the time.
The 50th percentile is the same as the median because it is the mid point in
the number of ranked observations. The 50th percentile is the value that
is equalled or exceeded 50% of the time - thus a failure rate of 50%, or
possibly five
times in every ten year period.
The rainfall that we record today is independent of the rain that fell yesterday, or the rain that will fall today. While there may be some seasonal patterns, the chance event of a particular amount of rain is random as far as the water balance modelling is concerned. Just because there was 124 mm in December last year, doesn't mean anything about the rain we will get in December this year or any other year. Similarly, the rain that fell on the 2nd January for each of the last ten years is unlikely to be the same - just random events. Hence the modelling is done with rainfall statistics that have some risk attached. Above, we said that median rainfall occurs 50% of the time - maybe. But median is not the same as average, since medium is simply the midpoint in a number of observations, while average is the arithmetical calculation of the total amount divided by the number of observations - definitely not always the same, but could be. In some locations the median is higher than the average, but in other locations the reserve is true.
The NSW Environment & Health Protection Guidelines On-site Sewage Management for Single Households (DLG et al., 1998) suggest that for a monthly water balance model, the median monthly rainfall values are sufficient. Obviously, the author/s of that document failed to understand that the summation of median monthly rainfall may be entirely different to the median annual rainfall. Calculations performed by Dr Robert Patterson, Lanfax Labs, indicate that for many towns in NSW, the summation of the median monthly rainfall amounts to less than the 30th percentile annual total. That means that when the median monthly values are applied to a water balance model, the model has a risk that the system will fail seven years in every ten - hardly a rational target (see Rainfall Statistics page).
The various statistics that may be used for such a water balance are set out in a Technical Note prepared by Dr Patterson, available through this website at Technical document -T15-2 Which rainfall statistic? There is a limit to what statistic (return period) is used. To use too high a percentile simply increases the cost without providing much in the way of reduced risk. It is necessary to consider that failure of a land application area may be dependent on the prior treatment of the wastewater. Sub-surface disposal of wastewater may be the preferred option when one considers long wet periods since the final treatment still occurs sub-surface, whereas surface applied effluent has the potential to runoff the site with the surface runoff during a storm event. Considerations as to application methods should be site and location specific.
The Australian and New Zealand Standard AS/NZS 1547:2012 cannot be forgiven for offering only a flimsy approach to water balance modelling, as set out in Appendix Q of that document. The section is 'informative only' and in accordance with the Standard is for "information and guidance only" (page 9). The Standard states "for land application systems, the natural water balance relationship has to be modified to take into account the applied effluent. In a sustainable system and over the long term, changes in soil moisture content can be seen as zero. However, on a day-to-day, or even a month-to-month basis, the change to moisture content becomes important. This statement can be interpreted as requiring the water balance to return to zero at some time throughout the year, but otherwise the in-field water content varies with additions and subtractions. That outcome is contrary to that required by the NSW Guidelines where there can be no interim storage of effluent in the soil.
5. WATER BALANCE
MODELLING
Most on-site wastewater modelling is done using monthly data as a conservative
approach to assessing the return of water to the hydrologic cycle. The aim
of the modelling is to mimic all the variables shown in Figure 4, allowing
for rise and fall in soil moisture within the acceptable levels for the soil
texture class, avoiding overflowing the system into the wider environment -
that's a fail. The bucket represents the system.
The land application area has to accept both rainfall and wastewater, although some rainfall will result in runoff when rainfall intensity exceeds infiltration rate. The losses from the land application area are evapotranspiration, interception store (water captured by the leaves and evaporating before reaching the soil), and deep drainage.
If these inputs and outputs do not cancel out (equal zero) then either some water has to be stored in 'wet weather storage', carted off-site or becomes a component of the potential water storage in the trench or soil profile. Refer to the equations about to understand the arithmetic involved.
Dealing with the return of the effluent from a wet weather storage back to the land application area when the soil moisture conditions are suitable is possibly a more difficult operation than dealing with the original effluent. The stored effluent is likely to putrify, bacterial populations increase, suspended particles settle and odour becomes an issue. This stored water may be of poorer quality than the initial wastewater before treatment. That such manipulation of wet weather storage be left to the homeowner is likely inviting real problems.
In accordance with Figure 4, rainfall may never reach the soil - evaporating from leaves of grasses, shrubs and trees. This process happens when we have small recorded rainfall events of less than 2 mm, but also happens to a small proportion of rain in higher falls.
 Water
infiltrates into the ground, that is, it simply moves from the
surface into the body of soil. The movement of water in the large pores and
by capillary action in the minute pores is termed percolation and can be measured with special devices and assigned
a percolation rate. As the water moves downward through the soil, plant roots
are able to access that water and return that water to the atmosphere as
evaporative losses.
Water
infiltrates into the ground, that is, it simply moves from the
surface into the body of soil. The movement of water in the large pores and
by capillary action in the minute pores is termed percolation and can be measured with special devices and assigned
a percolation rate. As the water moves downward through the soil, plant roots
are able to access that water and return that water to the atmosphere as
evaporative losses.
The terms infiltration and percolation are not the same and cannot be used interchangeably.
Further downward movement of the drainage water (moving in the larger soil pores) deeper into the soil profile becomes out of reach of the plant roots and is called 'deep drainage'.
At other times, water in the soil, within about a metre of the surface, may return to the surface by capillary flow and be lost from the soil surface, or again be absorbed by the plant roots closer to the surface, as shown in Figure 4. For capillary flow to occur, in any direction, the soil capillaries need to be full.
Now that we know the variables involved we can decide upon the calculations that we need to perform for each month to find the land application area (m2).
The inputs are: monthly wastewater volume (L), monthly retained rainfall depth (mm) (rainfall minus any calculated runoff - usually as a proportion of rainfall), and the unknown land application area (m2).
The outputs are: evapotranspiration (open water evaporation multiplied by a crop factor), deep drainage (losses beyond the root zone and capillary fringe), and an allowable storage component within the soil profile.
The outcome is a matter of juggling varying land application areas until the annual calculation results in zero, that is, some effluent can be stored in the soil over a few month, but at some time the model needs to return to zero soil water storage, ideally for at least six months of the year. It's a case easier said than done, although spreadsheets make the calculations easier where an iterative approach is easy to achieve.
Now we know what variables are required, we need to decide which monthly rainfall statistic we will use. Unfortunately, the lack of readily available data means that open pan evaporation (Eo) has to be average monthly data since daily data can only to be sourced directly from Bureau of Meteorology rather than through the website. The rainfall data are available from the website (http://www.bom.gov.au/climate/data/) for some prepared statistical values, or as raw daily or monthly data for the period the station has been recording. We will examine these latter values from which we can derive percentile values that meet our risk requirement.
Figure 4. Schematic of water balance in soil
6. SENSITIVITY TO
INPUT VARIABILITY
So let us assume that we had a reliable mathematic
equation to undertake monthly water balance modelling, which takes us back to
Section 1.
(Rainfall -Runoff) + Effluent = Drainage + (evaporation x crop factor) + Change in storage in soil or trench Equation 1.
Equation 1 is run for each month with relevant changes to the inputs. Excess water may be stored within the soil (for irrigation) or the storage capacity within the trench. Perhaps the latter needs some explanation because excess monthly effluent must be stored somewhere, otherwise the trench or irrigation area become excessively large and expensive.
The idea of a special wet-weather storage tank is just asking for public health and hygiene problems and serious management issues with regards to getting that stored effluent out into the land application area. Such management is well beyond the capacity of the household to perform; hence the public health issue. The alternative is to have excess effluent stored in the soil for irrigation systems, or stored within trenches.
To test the sensitivity of the inputs, we accept that excess effluent can be stored in the soil profile under irrigation up to a maximum of about 120 mm per metre depth of soil. That value is approximately the same for loams and clays and is the difference between the field capacity and wilting point, two properties than can be easily measured or taken from technical texts. For a soil with a porosity of about 40%, about 50 mm of effluent can be stored without seriously overloading the soil. We therefore set our target 'in-soil' water storage in the modelling to 50 mm of effluent.
The same water balance model, as used under the heading "RAINFALL STATISTICS", Table WB-11, has been set out to show the sensitivity to the model by small changes to the input variables for a household generating 600 L of wastewater per day in Armidale NSW (BOM Station 56037). The discussion under "Rainfall Statistics" addresses the use of different rainfall data. For this exercise the average monthly rainfall data and the average monthly evaporation rate will be used. Only one variable was changed at a time to compute the values in Table WB-1 and reset to the standard before the next variable was reset.
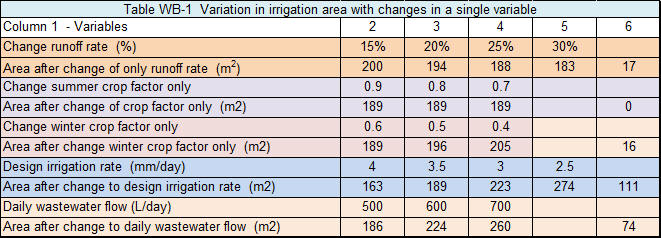
You can see the changes across columns 2-5 with the change (m2) across the range shown in column 6. So how sensitive is the modelling to changes in ONE variable? The runoff rate (orange rows) is slightly sensitive; the summer crop factor (mauve rows) is insensitive; slightly sensitive for the winter crop factor (purple); highly sensitive to the soil texture (blue) which determines the design irrigation rate; and very sensitive to daily wastewater flow (pink).
The soil type and daily wastewater flow regimes are critical to this type of modelling for which an understanding of the soil profile is essential, while the household must understand that for their particular soil type, water conservation can play a significant on-going performance factor.
What if we were now to develop a multi-variable change to the table above without it being too complex? That's where the spreadsheet approach to a water balance modelling exercise is invaluable, we can change several variables at once and we can test the sensitivity to those changes.
7. STORAGE OF
EFFLUENT IN GROUND
The Nominated Area water balance example set out in the NSW Guidelines (page 155)
completely
ignores the potential for storing excess effluent in the soil and uses
cumulative storage to either choose a large size irrigation area or complete the
calculations again until there is no cumulative storage. The nominated area is then the area that requires no
storage. How insensitive a method to not consider that the soil has a
finite water storage capacity based upon soil type, depth and area for land
application! The bucket analogy above seems to be lost on the
Guidelines. There is no benefit in keeping the bucket empty, quite the
contrary. All that is achieved by the Nominated Area method is an area so large
that, at no stage, is there water in the soil. Can you believe it? Such a design
will lead to vegetation in an irrigation area that fails to survive a long hot
summer. Some plan!
The excess effluent can be safely and effectively stored in the soil or the trench, overcoming the health and environmental concerns about maintaining a wet-wet weather storage.
In the soil profile in the irrigation area there is a porosity of about 40% that can be used to store excess effluent during wet times and draw-down during dry times. In the pipe trench, the sum of the volume of the pipe and the gravel amounts to about 40% porosity so in a given length of trench there is the ability to store significant quantities of effluent. In the tunnel trench, the sum of the gravel and tunnel amounts to a porosity of 70%, storing almost twice the effluent as a pipe trench.
While other factors may also be important, the ability to store water in the soil against the drainage capacity of the soil results in smaller disposal areas and avoids the problems of wet-weather storage
Figures 5 a,b and c showing water storage component in soil
and in trenches
Let us assume that for the dripper irrigation above, the area required for the assimilation of the effluent has been calculated as 200 m2. Assuming the soil depth is at least 1.0 m with a typical soil void ratio of 40%, then the irrigation area has the capacity to store 40% of 200 m3 of effluent, or 80 m3 of effluent, equivalent to 80,000 L when saturated. It would be prudent to use only a proportion of this storage capacity in calculating the design irrigation area but that value would depend upon the rainfall and evaporation values used in the water balance. Designing to the monthly 50th percentile rainfall is mostly designed for a failure in excess of five years in ten (see rainfall statistics) and a large reserve capacity for storage in the soil would be expected. Using a higher return period the modelling outcome will give a larger irrigation area and also a larger soil storage component.
The water storage capacity in a trench system, depending upon a piped trench or an arched tunnel trench, can easily be calculated as the length of the trench times the cross section of the trench for only the pipe and gravel section, usually the bottom 200-250 mm as shown in the figure above. The storage capacity in a trench can be significant as shown in the Technical note T20-3 Sizing an Effluent Trench.
As for designing the irrigation area by allowing a proportion of the soil water storage capacity to be held over several months of the year, with the majority of months at zero depth, a trench system can also be sized to allow for in-trench wet weather storage for a proportion of the depth. Again, if the lower return rainfall period is used (50th percentile monthly), then a larger proportion of the in-trench storage will be required for a longer period. At no time should the storage capacity extend to the full 12 month period.
8. CONCLUSION
An understanding of the components and their interaction in a water balance
model is essential. The old adage "garbage in is garbage out' certainly
applies to wastewater modelling. While a mathematical model may appear
robust, until realistic data are selected the model is only
window-dressing. The poorer the data, the higher the risk of land
application area failure. The 50th percentile monthly rainfall values are
inappropriate as demonstrated in the Technical
Paper on Rainfall Statistics. Ideally, one needs to choose a return
period around the 70th percentile monthly values.
Any water balance modelling must take into account the risk of failure from rainfall periods greater than the model uses. Simply accepting median monthly values because that is all that is required to meet NSW regulations is really keeping one's head in the sand. In the calculations referred to above, most median monthly values reflect the 30th percentile annual rainfall. Similarly, the mean or average rainfall generally has a 50% failure. Some councils consider the 90th percentile monthly values are worthy rainfall figures, yet the summation of monthly 90th percentile rainfall figure often exceeds the annual total for the wettest year on record, sometimes for records longer than 100 years. Accepting such inputs verges on the unbelievable, that is, one can only assume the Council officers have a poor understanding of rainfall statistics.
It is my view that the monthly 70th percentile monthly values, which generally equate to about the 80th percentile annual values, provide a reasonable degree of protection to the environment. The larger areas calculated using this scenario (70th percentile monthly values) also provide larger in-field storage of effluent to account for water losses in dry times. However, the annual water balance must return to zero for several months of the year.
It is disappointing that there have been two editions of the Australian Standard that omitted the water balance model, last included in the 1994 version. The reason for its discontinuance is a mystery. As for the water balance in the NSW Guidelines, unchanged since inception in 1998, one can only wonder why the capacity to store water in soil has been denied and Councils continue to challenge modelling that includes a naturally variable soil water storage capacity. Soil water storage is kindergarten stuff, easily accommodated in spreadsheet modelling using iterative techniques.
These conclusions are examined in detail, with further explanation in the pages on Rainfall Statistics.
Reterences:
Australian and New Zealand Standard AS/NZS 1547:2012 On-site domestic wastewater management. Standards Australia, Sydney and Standard New Zealand, Wellington NZ.
Bureau of Meteorology Climate Data Online http://www.bom.gov.au/climate/data/index.shtml
DLG et al., (1998) Environment and Health Protection Guidelines. On-site sewage management for single households. Department of Local Government and others, Sydney